The Situation
The company has hundreds of reps in the field, and its operation has run on mobile since 2012: fourteen years of real, structured data. Yet the system around that data is a legacy one, with little insight beyond a simple summary view. Every additional data point was a request to the developer who started the project fourteen years ago and has maintained it since. Reports were the same story: a one-time pull, or the cost of automating them properly.
The owner wanted to ask the business questions and trust the numbers that came back. The obstacle was not the model. The data holds personal and financial details about the company’s customers, so pointing an AI tool straight at the database was never an option, and a number nobody can trace back is worse than no number.
What We Did
Nothing in the existing system was rewritten. We built a separate, read-only layer beside it.
Every night, a copy of the database is taken with personal data stripped on the way: names, identity numbers, contact details, addresses and free text never make it across, and customers become tokens that can’t be reversed. Only allowed columns are copied, and the import fails closed: if an identifier slips through, the previous copy stays in place.
Numbers are made one way only. A catalogue of typed, hand-written queries is the only thing that reads the copy, through a database role that can read and nothing else, so read-only is enforced by the database, not by a prompt. The dashboards, the API and the assistant all use the same queries, so a figure is the same whether it comes from a chart, a report or a chat.
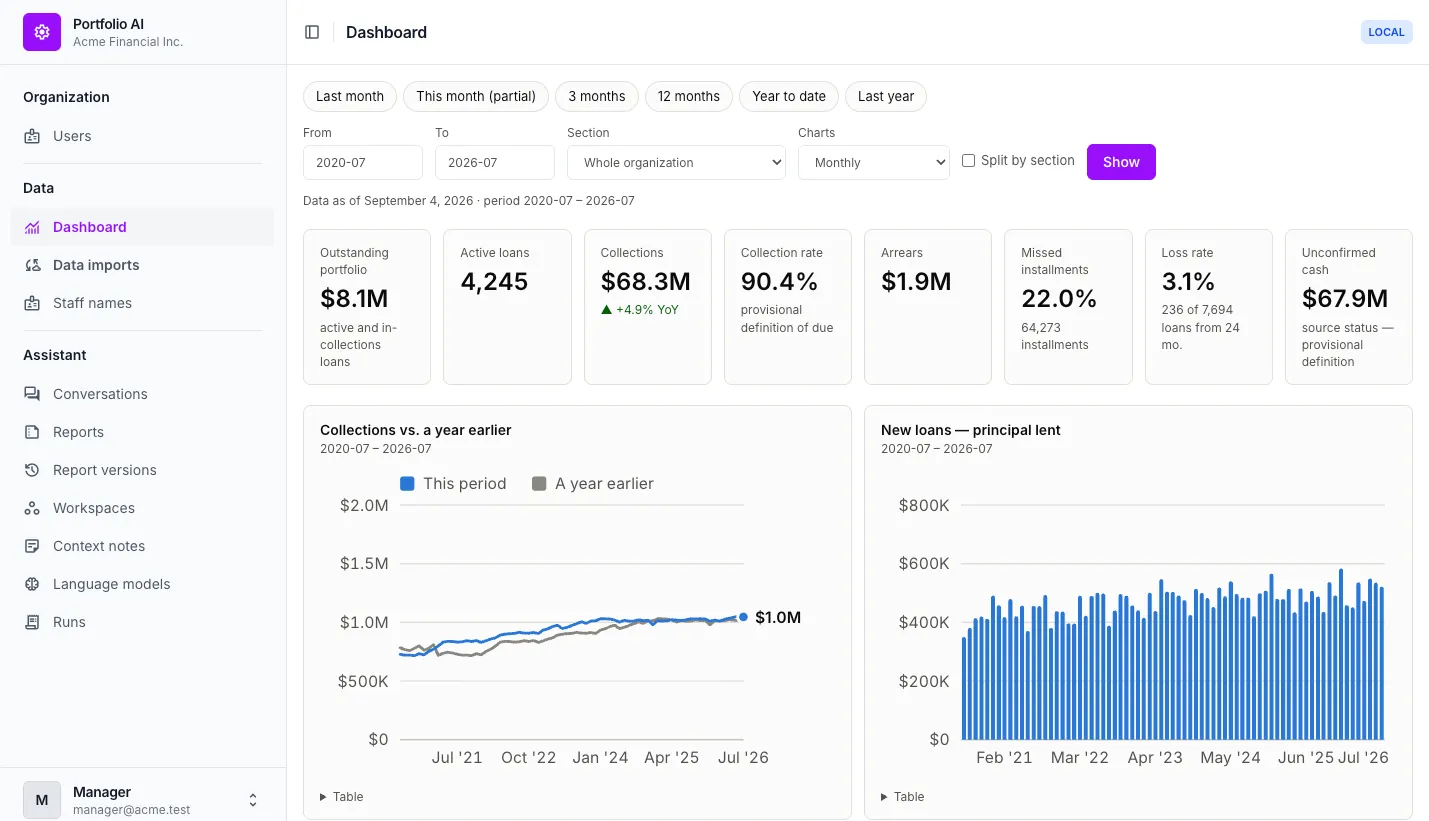
The dashboard: portfolio, collections, arrears and loss rate for any period, from the same checked queries the assistant uses. All screenshots show dummy, anonymized data for demo purposes.
The assistant runs on Anthropic’s Claude, carries the company’s context and answers through those queries. The figures it shows are re-run by the system, never copied from the model’s text, and every answer lists the queries behind it. Periodic reports are prompts written in plain language, run on a schedule or on demand, with every version kept, and they can be expanded from a phone by asking for more.
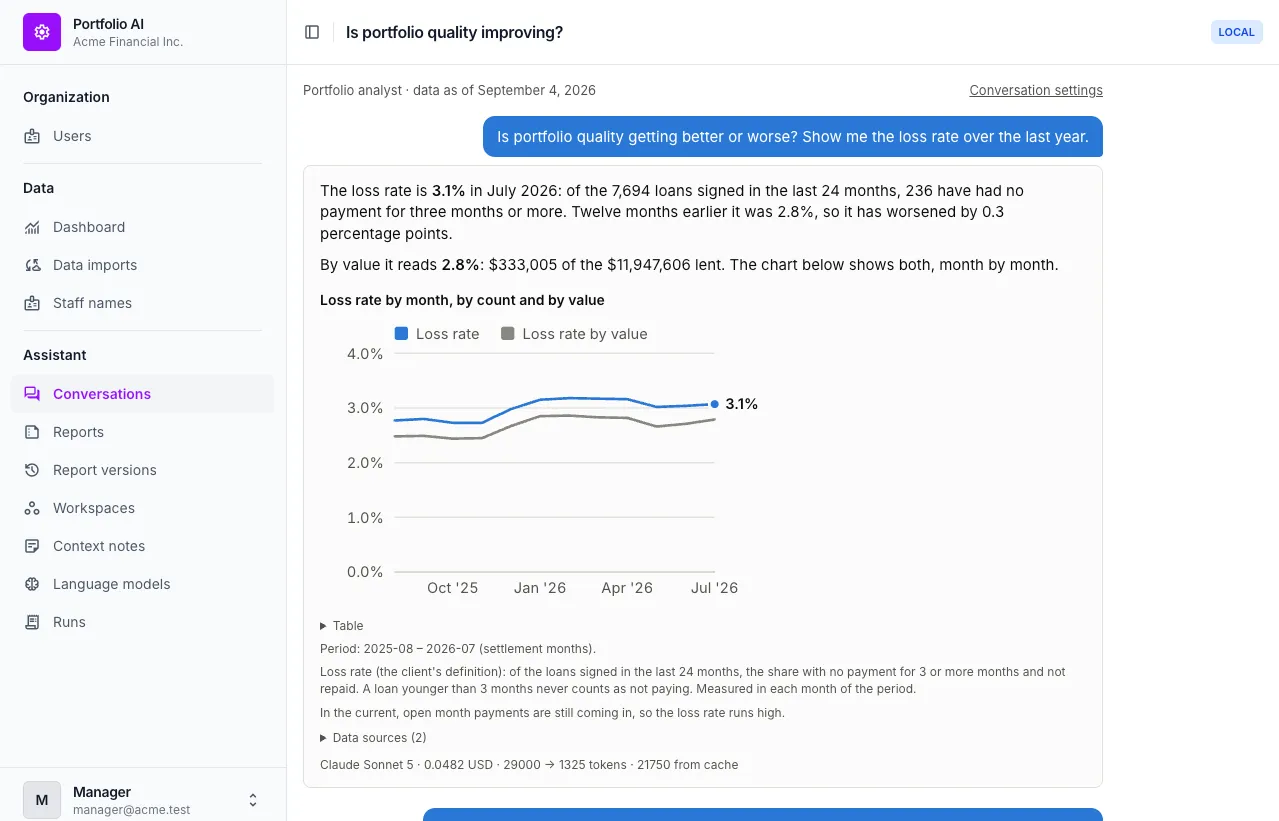
An answer from the assistant: the figure, a chart, the client’s definition behind it, its data sources and the cost of the call.
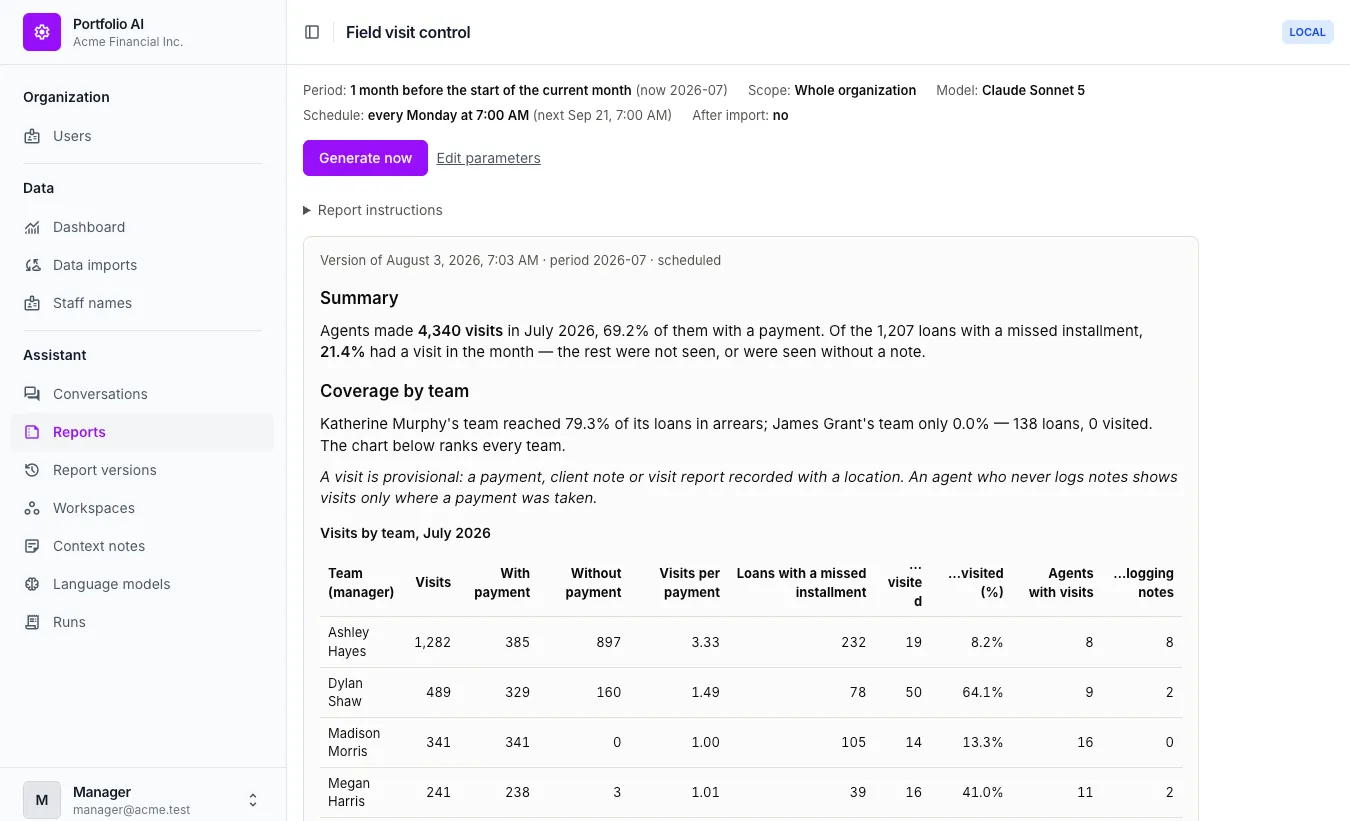
A report written as a plain-language prompt and run every Monday: field visits by team, with the definition it rests on.
Before any of it was shown, every figure was computed twice, once by the product and once by hand against the source, until the two matched exactly. Checking rather than assuming also surfaced what an audit would: dates stored in more than one encoding, status codes with no legend, and two sources in the system that disagree. Those became questions for the owner, not assumptions baked into the numbers.
What Moved
The owner now asks the business questions on a phone: dashboards with depth into collections, arrears, field visits and cost per rep, an assistant that works from the company’s own rules and shows where each figure came from, and reporting that grows by asking the right questions. The model reads a copy with no names in it. Every AI query is logged with its parameters, the rows it returned and its cost, under a spend cap.
What changed, in the company’s own terms:
- New metrics: none in two years, then ten or more in one session. Every new number used to be a request to the developer who maintains the system. In the first working session on the new layer, the owner pulled more than ten custom reports himself.
- Reporting: weekly and monthly, now whenever it’s needed. Reports run on demand, after each nightly import, or on a daily, weekly or monthly schedule, and every version is kept.
- Data in reach: two tables, now twenty-three. The old reporting view exposed agreements and installments, filtered by consultant and then listed by client. The layer catalogues 23 tables behind 20 checked queries, so collections, arrears, cash in the field, agent economics and field activity are all answerable.
- Analysis: none automated, now five scheduled checks. The old system printed data for someone to read. Scheduled reports now watch missed installments, unvisited agreements, schedule deviation, new arrears and cash still in the field, and flag what moved.
Every figure behind them was computed twice, once by the product and once by hand against the source, until the two matched exactly.
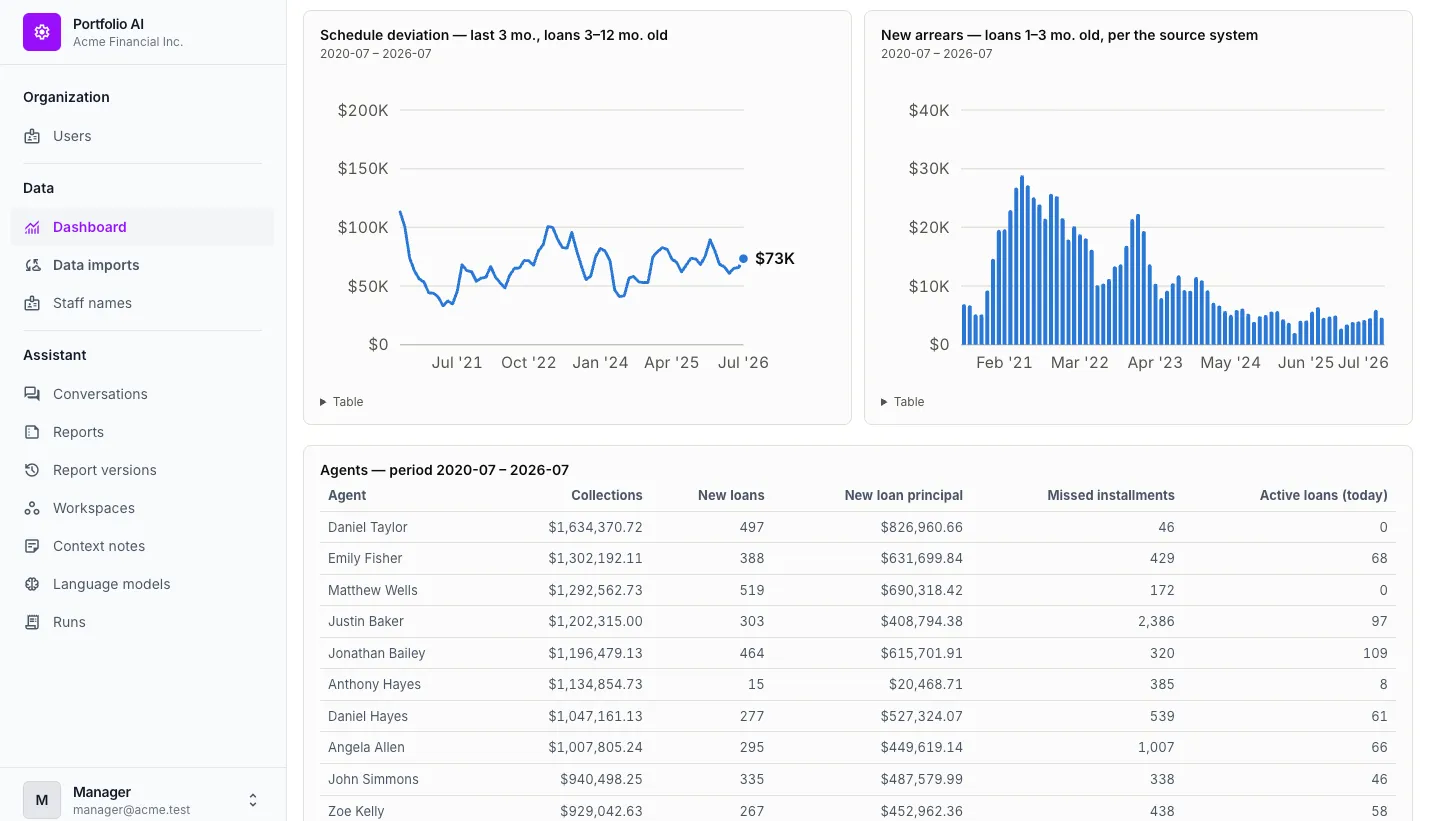
Further down the dashboard: schedule deviation, new arrears, and collections and new loans per agent.
Where It Went
It isn’t modernized software yet. It’s a window into the current system: the owner can talk to AI about the company, based on real data and the business’s actual rules. The next step is going through the definitions with the owner, so the numbers mean exactly what the business means, and what the checks exposed underneath is where a modernization would start, if the business wants one.